SEO CTR Benchmarks Report
SEO CTR Benchmarks Report
In-depth CTR analysis to identify problems, anomalies, and key opportunities for growing your website’s Google organic traffic
Key benefits of this report
⭐ Preventive SEO Risk Management
Promptly identify queries where CTR starts to decline so you can take quick action, minimizing traffic and revenue loss.
⭐ Quantify Losses and Potential Gains
Calculating lost traffic helps you prioritize SEO efforts to recover and improve performance.
⭐ Identify Non-Obvious Problems
Spot queries that aren’t achieving the expected CTR and lag significantly behind your site’s averages, indicating possible issues with snippet quality or a mismatch with audience expectations. Focus on optimizing these for maximum impact.
⭐ Identify ‘Hidden Gems’
Recognize high CTR queries in lower positions, then optimize your site for them to boost your traffic and improve your rankings.
What’s inside?
This is a group of reports that segments data into various categories:

CTR Drop Impact
Identifies queries with a noticeable drop in CTR with a small change in position and calculates traffic lost due to the CTR drop.

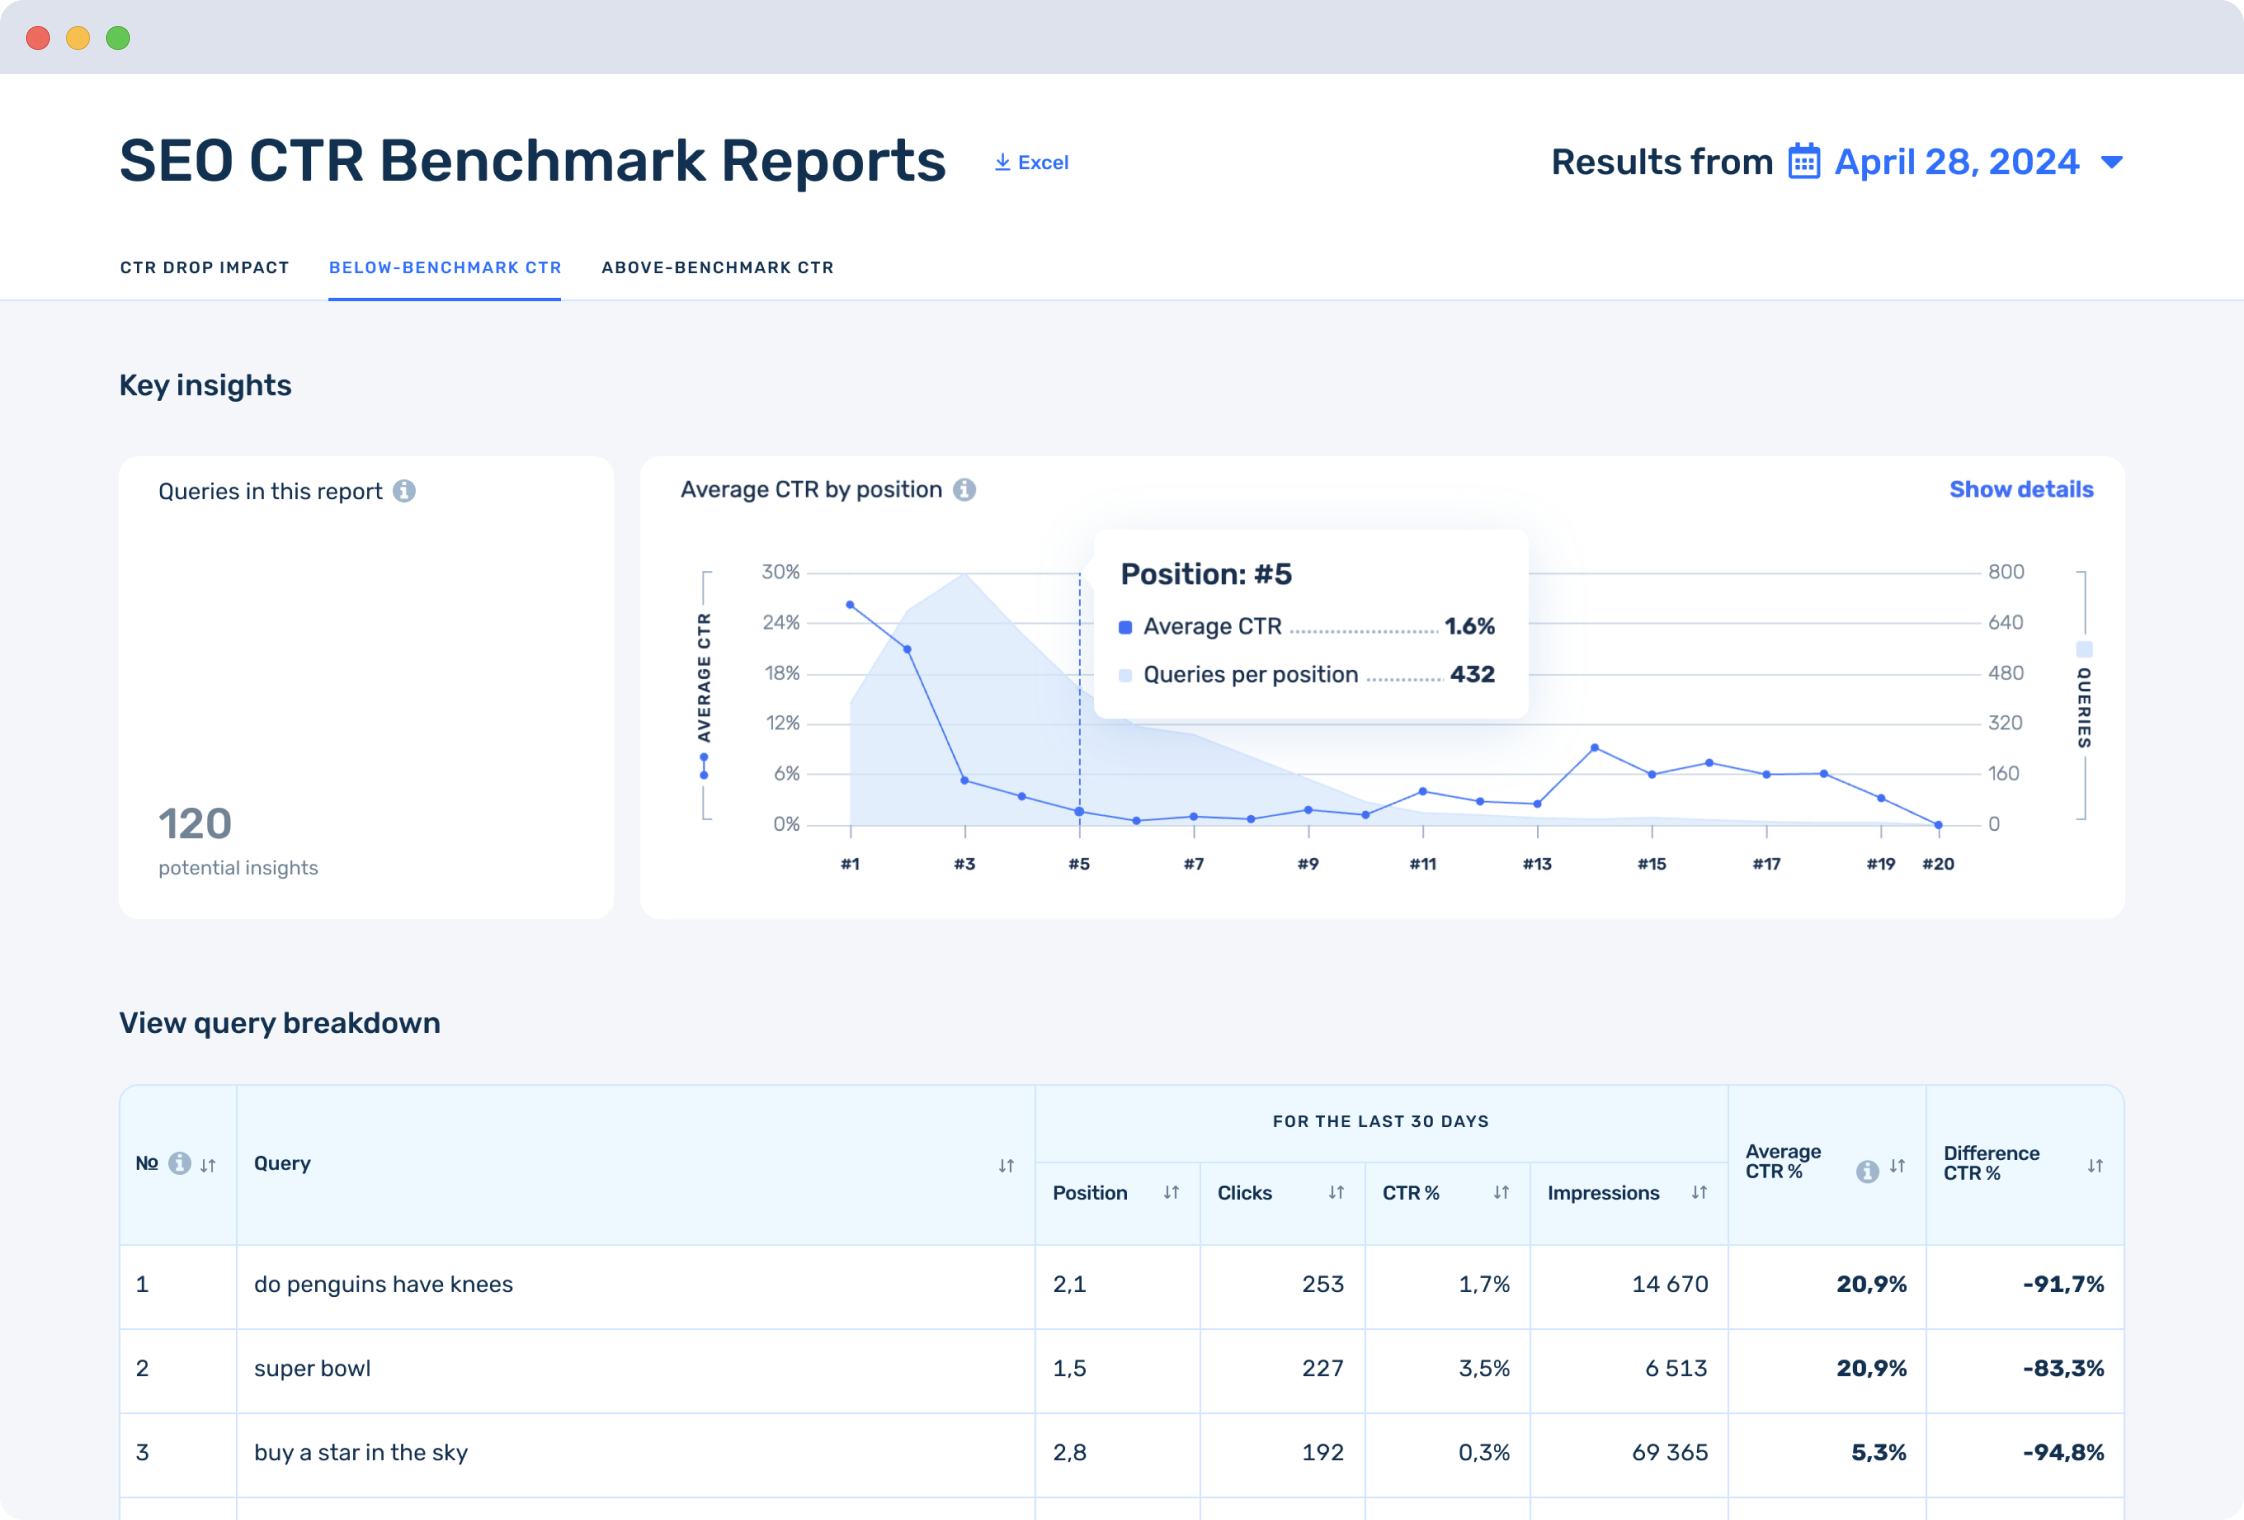
Below-Benchmark CTR
Flags queries with unusually low CTR compared to the average CTR of most other queries on your site at the same position.

Above-Benchmark CTR on Lower Positions
Identifies queries whose CTR is significantly higher than the average CTR of most other queries on your site at the same position.

Traffic Opportunities Metrics + Average CTR by Position
Metrics highlight the volume of queries impacted by specific issues (“Queries in this report“) and estimate the potential traffic you’re missing out on (“Missed Traffic“) but could gain by addressing the queries highlighted in the report.
We also show the Average CTR by position statistic for your site queries, which is used in the Below-Benchmark CTR and Above-Benchmark CTR reports. This statistic also shows the distribution of query volume by position and in the current version covers the first 20 positions.
How does Buddler generate the SEO CTR Benchmarks Report
Collecting and filtering data
We gather query-specific data from Google Search Console for the last 30 days to analyze the current state, and for the previous 12 full months.
Then identify queries with significant traffic and analyze the data for each query and determine the most productive month for it.
Analyze CTR difference and count Missed Traffic
We calculate the Difference CTR by comparing the current CTR with the best-performing month for each query. We also calculate the missed traffic for each query — the amount of traffic the site could have received if it had the same CTR for the last 30 days as in the best month.
Calculate benchmark Average CTR by Position
For your site’s queries, we determine the Average CTR by position for the first 20 positions, i.e., the average CTR your site has when it is in the first position in the output, the second, the third, and so on up to the twentieth position. This benchmark is further used to generate Below-Benchmark CTR and Above-Benchmark CTR reports.
Dividing requests into categories to generate reports
To generate reports, we divide requests into three categories: CTR Drop Impact, Below-Benchmark CTR, and Above-Benchmark CTR. We also divide the data by country.
Result: simple and understandable table for each category

Frequently Asked Questions
for SEO CTR Benchmarks Report
-
Organic Click-Through Rate (CTR), or SEO CTR, measures the percentage of searchers who visit a web page from the search results. It reflects the effectiveness of your search listings in attracting clicks. CTR in organic search is influenced by the relevance of your content to the searcher, your website’s ranking position in search results, and the appeal of your title tags and meta descriptions in enticing users to click.
-
The report is most beneficial for sites that meet specific criteria:
- Sites registered in Google Search Console: ensure your site is added to GSC to access the necessary data for analysis.
- Sites with a significant number of pages: this report is ideal for websites with large, complex semantics. If your site has tens, hundreds, or thousands of pages, it provides valuable analytics.
- Sites with substantial Google search traffic: for meaningful insights, sites should have significant organic traffic. The analysis may not yield informative results if your site receives minimal traffic (e.g., 100 clicks per month).
- Sites with a history in Google Search Console: typically, this history spans 8 to 10 months. Newly added sites to GSC may lack sufficient data for analysis. It’s advisable to wait until your site accumulates more history before utilizing the report.
- Sites not exceeding 15 million annual Google clicks: currently, our reports are optimized for sites with lower traffic volumes. However, we are happy to provide tailored solutions to accommodate larger sites. Contact our customer support for assistance.
-
For each query in the CTR Drop Impact report, we calculate the amount of additional traffic a site could have received if it had maintained the same CTR for that query in the last 30 days as in its best month. However, the Below-Benchmark CTR and Above-Benchmark CTR reports contain queries exhibiting abnormal behavior for which there may be different reasons, so we do not count dropped traffic for queries in these reports.
-
We calculate the average CTR of your site’s queries for the first twenty positions over a period of 13 months. Fractional positions are grouped by ranges: for example, the position 2 statistics will include queries with a position greater than 1.5 and less than 2.5.