Traffic Attrition Reports
Traffic Attrition Reports
Discover how much organic traffic you are missing based on search query types
Who will benefit from this reports?

Business Owners
Get a quick, top-level view of your site’s performance in Google. Learn how much organic traffic your site is missing due to declining rankings.

Marketers
Identify your SEO strategy’s weaknesses by selecting the most promising topics and queries.

SEO Professionals
Improve traffic forecast with a simple and comprehensive dive into client websites. Eliminate manual GSC data processing, receiving challenging queries for your sites in one click.

Digital Agencies
Valuate clients’ website capabilities for commercial offers for your commercial proposals. Delegate complex analytics to Buddler, freeing up your team’s time for other crucial tasks.
What’s inside the reports?
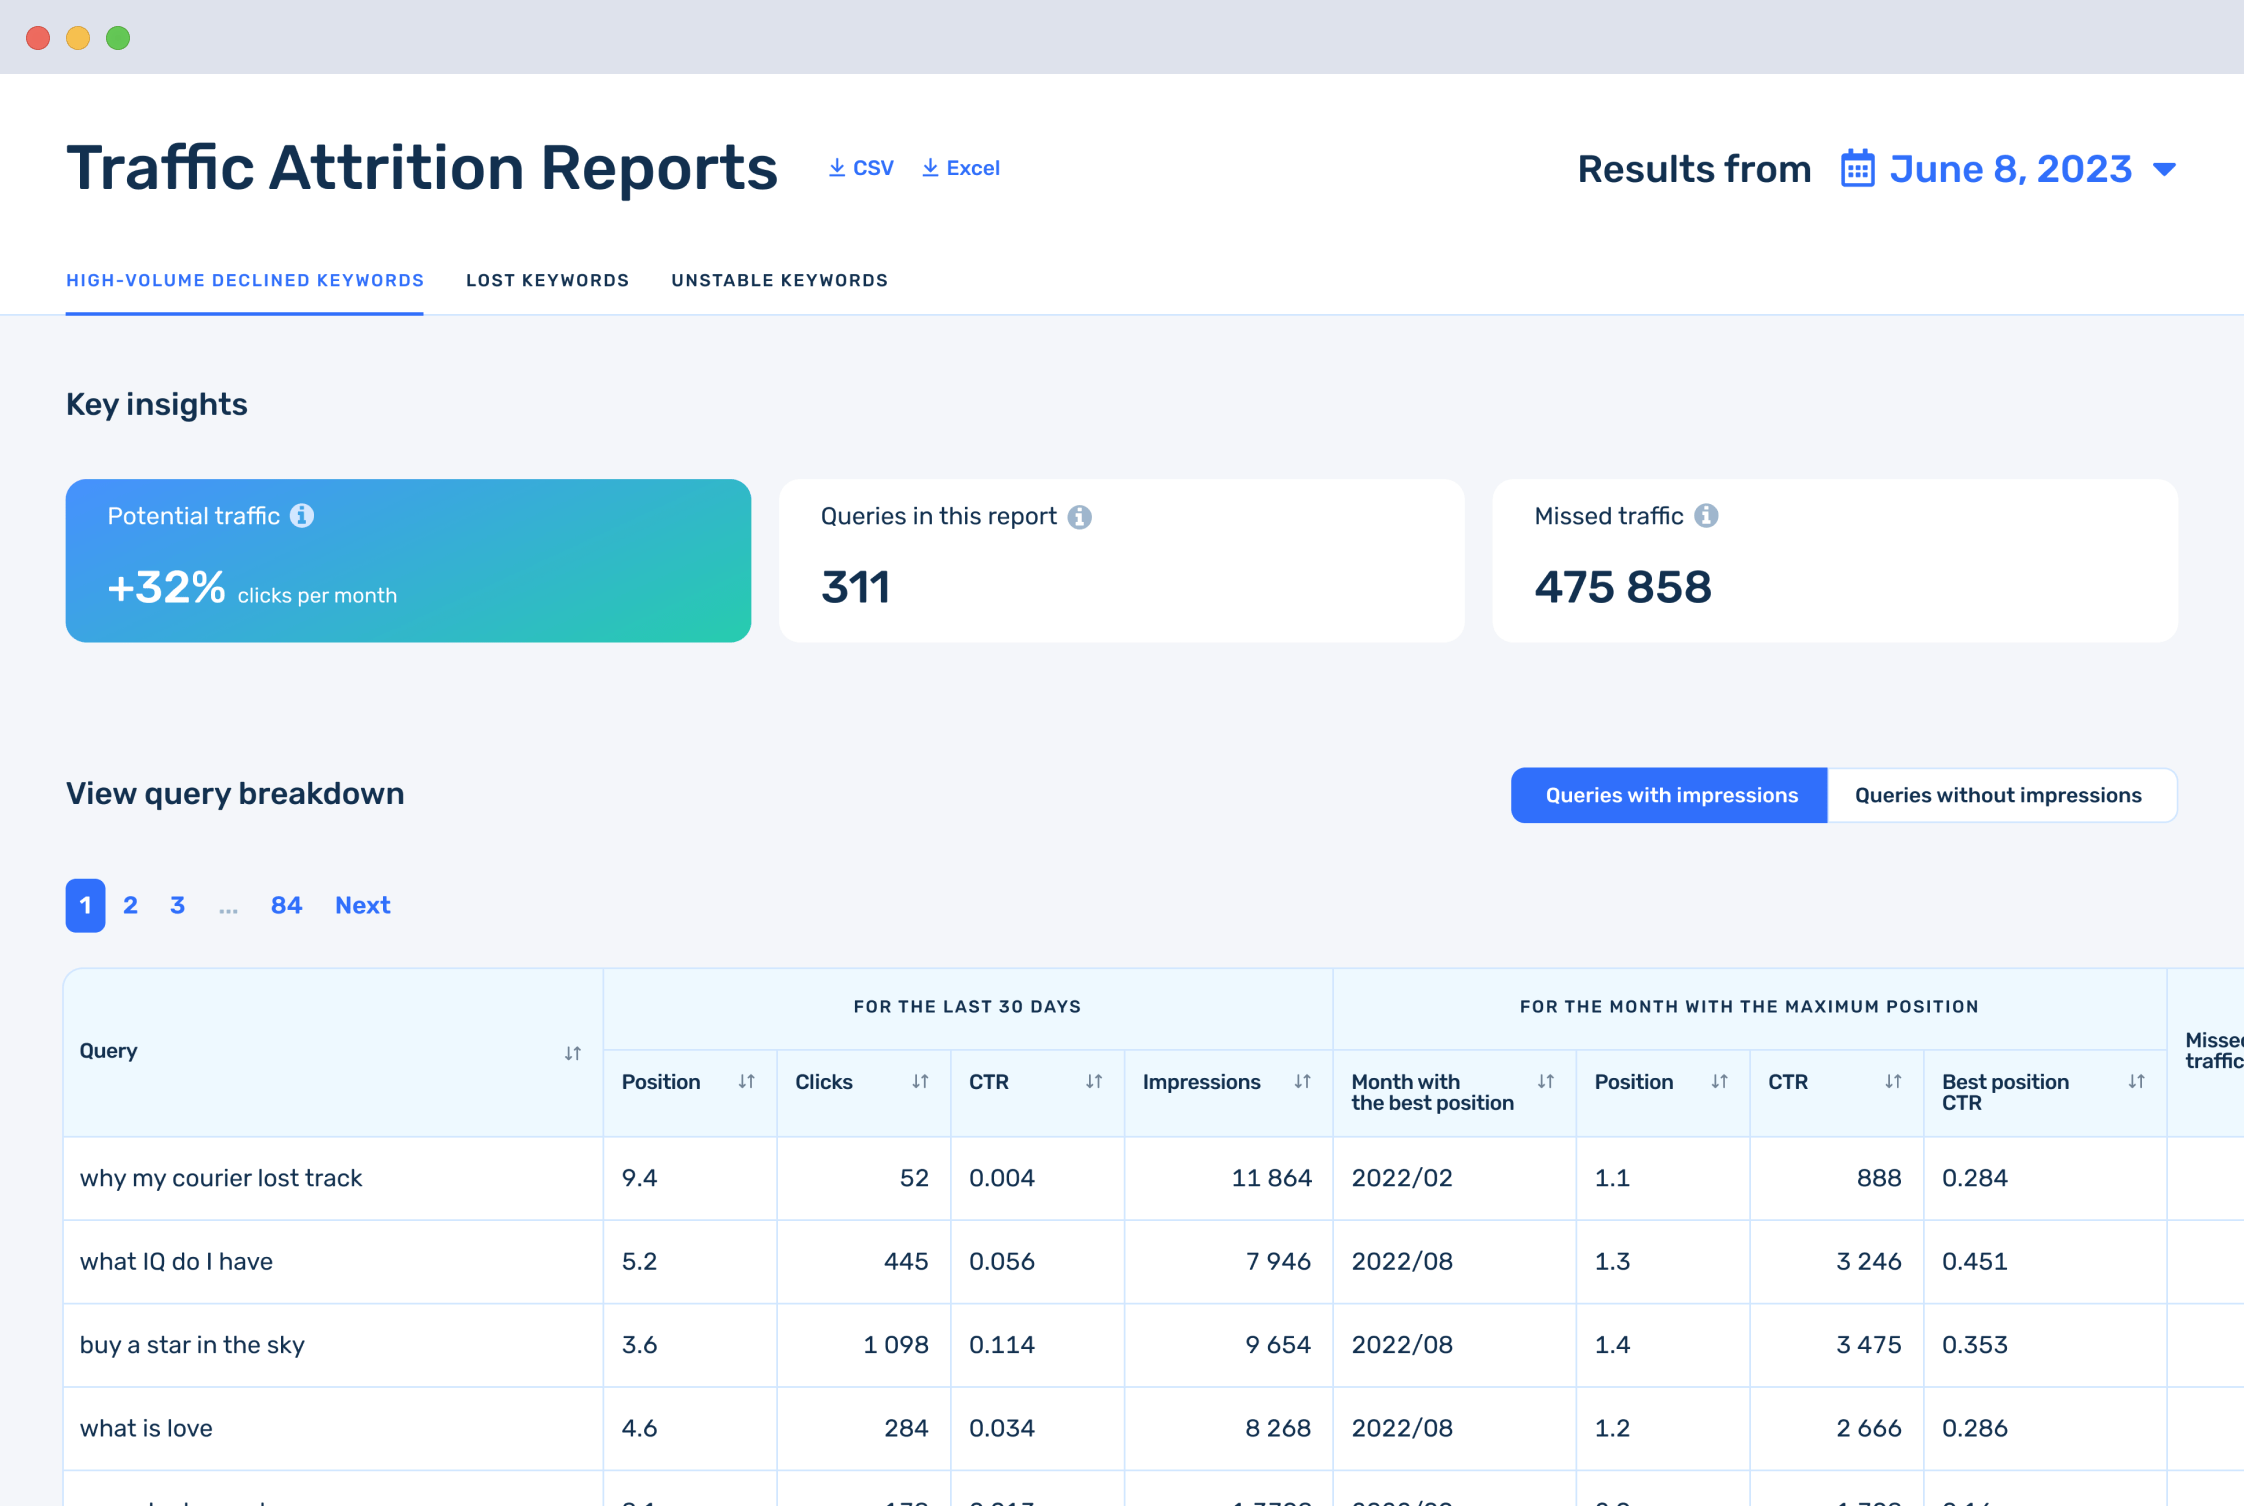
The report segments data into different keyword categories

High-volume declined keywords
Queries that previously ranked higher and delivered regular traffic have recently lost positions and provide less organic traffic than before

Lost keywords
Queries that previously ranked higher than now and provided traffic on a regular basis but now don’t bring any traffic at all

Unstable keywords
Queries that are unstable while generating traffic, such as seasonal queries, but which have taken higher rankings than now

Traffic Opportunities Metrics
Uncover untapped traffic opportunities with key insights Metrics highlight the volume of queries impacted by specific issues (“Queries in this report“) and estimate the potential traffic you’re missing out (“Missed Traffic“) but could gain by addressing the queries highlighted in the report.
Bonus: These metrics are available at no extra cost as part of the site audit.
How does Buddler generate the Traffic Attrition Report
We evaluate search queries made on Google, where your site appeared in GSC over the entire period
To ensure we can track the complete history for each query, we fill in the data for each period (GSC only presents this data in charts)
We determine when the site had the best positions for each query, and then we calculate the degree of performance decline
We calculate the volume of lost traffic for every query that previously brought more than it now does
For your convenience, we display data in logical groups: High-volume declined keywords, Lost keywords, Unstable keywords
We count metrics-key insights for each group


We create a simple and understandable table for each group

What Traffic Attrition Reports help with
Identify why organic traffic is decreasing, highlighting problematic queries that have dropped in search rankings and the reasons behind the decline. This helps prioritize which ones to address first.
Identify queries where increasing traffic may be more easier, as these queries have previously generated traffic for your site
Uncover missed traffic opportunities by understanding your site’s seasonal trends and query instability
Measure effectiveness of queries for creating a content plan
Analyze the historical performance of each query and compare it with the periods when your site underwent changes or optimizations
Create a one-page optimization plan with clear KPIs and traffic estimates
Frequently Asked Questions
about these reports
-
The report may not offer insights for every site, as it requires specific criteria:
- Sites registered in Google Search Console: Ensure your site is added to GSC to access the necessary data for analysis.
- Sites with a significant number of pages. Ideal for websites with large, complex semantics. If your site has tens, hundreds, or thousands of pages, this report is designed for you, providing valuable analytics.
- Sites with substantial Google search traffic. For meaningful insights, sites should have significant organic traffic. If your site receives minimal traffic (e.g 100 clicks per month), the analysis may not yield informative results.
- Sites with a history in Google Search Console. Typically, this history spans 8 to 10 months. Newly added sites to GSC may lack sufficient data for analysis. It’s advisable to wait until your site accumulates more history before utilizing the report.
- Sites Exceeding 1 Million Annual Google Clicks: Currently, our reports are optimized for sites with lower traffic volumes. However, we’re happy to provide tailored solutions to accommodate larger sites. Contact our customer support for a assistance.
-
Every Google click on your website is the result of a user query. As a result, any SEO website optimization must begin with basic work, which must include the collection of a semantic core. In this manner, an SEO specialist/marketer/manager understands what queries a site can rank for and how much traffic these queries can generate when a specific website achieves top positions and makes predictions. However, the more semantics a project contains, the more difficult it is to keep track of it and avoid missing red flags.
-
When analysing queries for a website, you need to take into account their relevance, frequency, complexity, PPC competition indicators and much more. But to really understand what is happening with a query, it is enough to know whether it is a new query or one that has already had good results in terms of positions and traffic. If a query previously had better results, then you’ve lost what you had and it makes sense to get it back. New queries can be added indefinitely to acquire a larger market share, but only if you control what you have and don’t lose it.
Analyzing queries with Buddler doesn’t require you to do any serious manual data mining and doesn’t take up much of your time. When you run the report, we collect and process all the data for you and show you only those queries with problems that promise to work on numerically. Whatever your level of expertise in analytics and SEO, you will gain insight quickly and effortlessly.