Picture this: you’re going on a road trip through the online world, and you need a reliable GPS to navigate. Google Search Console’s Performance Report is like that guide, giving you real-time data to make smart decisions.
This report provides an in-depth overview of your website’s performance in search results. This article will cover the report’s key indicators, enabling you to evaluate your SEO strategy’s success and understand how consumers interact with your online resource in the search environment below.
Performance Report and its Key Indicators
What are the key indicators of the Performance Report? Let’s analyze them below.
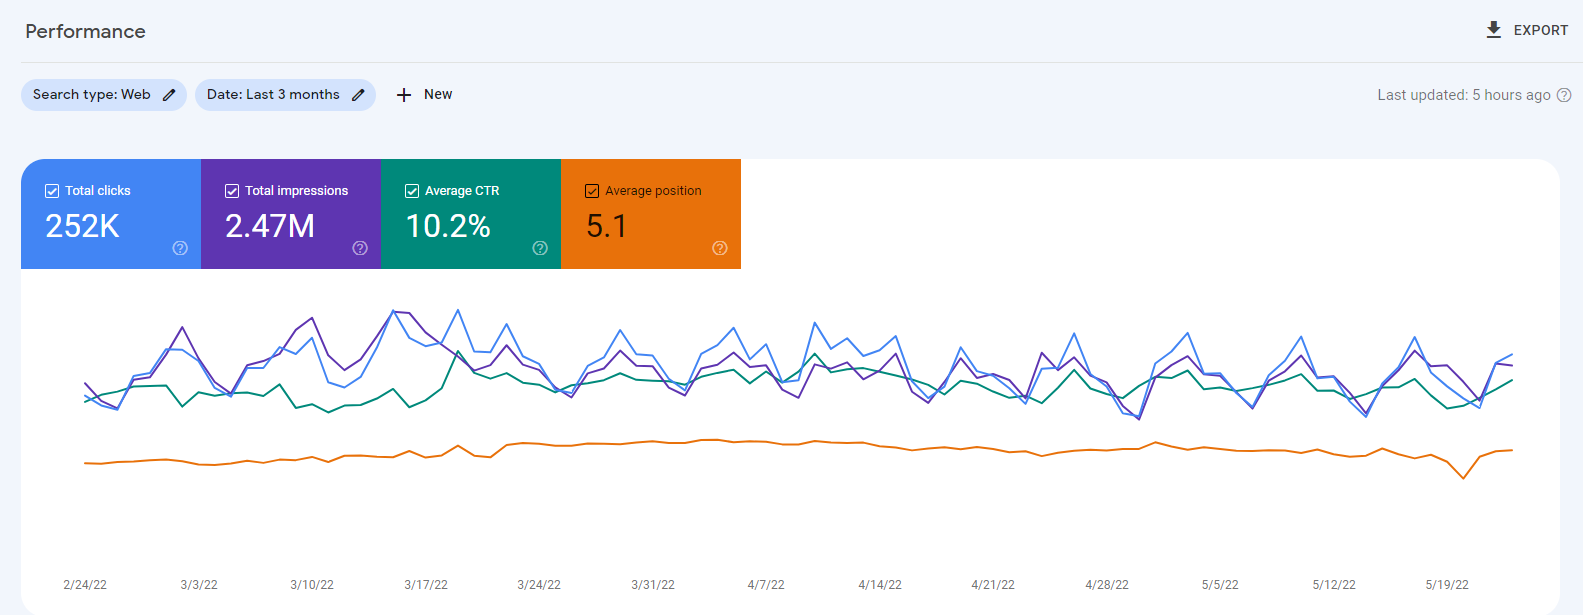
• Clicks: This is an essential indicator of the level of interest and engagement generated by the search results on your website. A click occurs when a visitor decides to visit your site by clicking on the link after searching and seeing it mentioned in the search results.
You can learn how effectively your platform attracts visitors and generates traffic by monitoring clicks. By analyzing click data, you may improve the pages or search results that get the most clicks. This can help you increase engagement and conversion with the help of SEO.
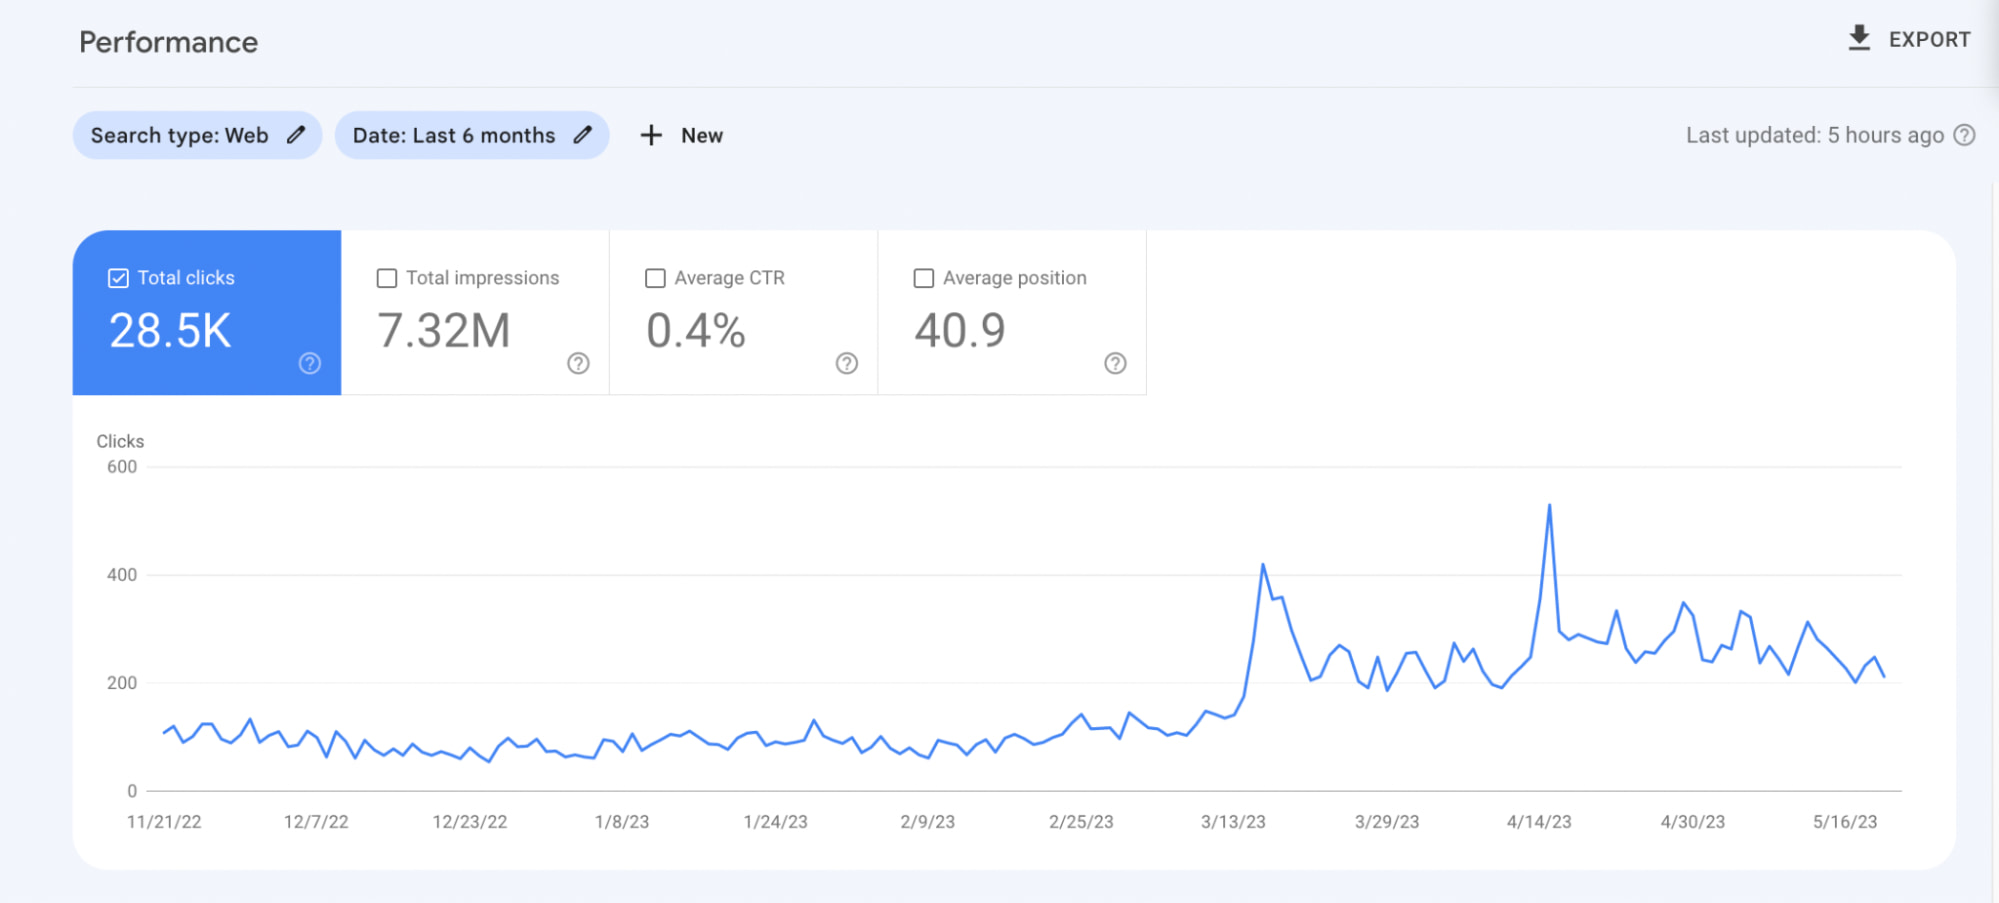
To test this indicator (the below-mentioned steps can be used for all other indicators of the Performance Report):
- Click on “Performance” to access your site’s performance report. By default, the report page displays a graph with clicks, impressions, CTR, and average position data.
- Press on the “Clicks” data. To study a specific period, change the date range if needed.
- For deeper insights, use the multiple filters and dimensions offered to segment the data by queries, pages, countries, devices, etc.
- Using the date comparison feature, compare the Clicks data to a previous period to find patterns and changes in user engagement.
- Switching to the “Charts” view, which provides a graphic representation of clicks, will allow you to see the Clicks data over time.
- Click the “Export” button and select the format (e.g., CSV, Google Sheets) to export the data for the Clicks indicator or the Performance report.
• Impressions: This indicator shows how accessible and visible your online resource is in the SEO world.
Every time your site appears on a search result page, an impression is recorded, and to grow all other metrics, you must first increase impressions.
You need to focus on impressions to evaluate the success of your web platform’s SEO efforts regarding visibility and exposure. The more impressions your site receives, the more frequently it appears in search results, which may enhance brand awareness and further traffic.
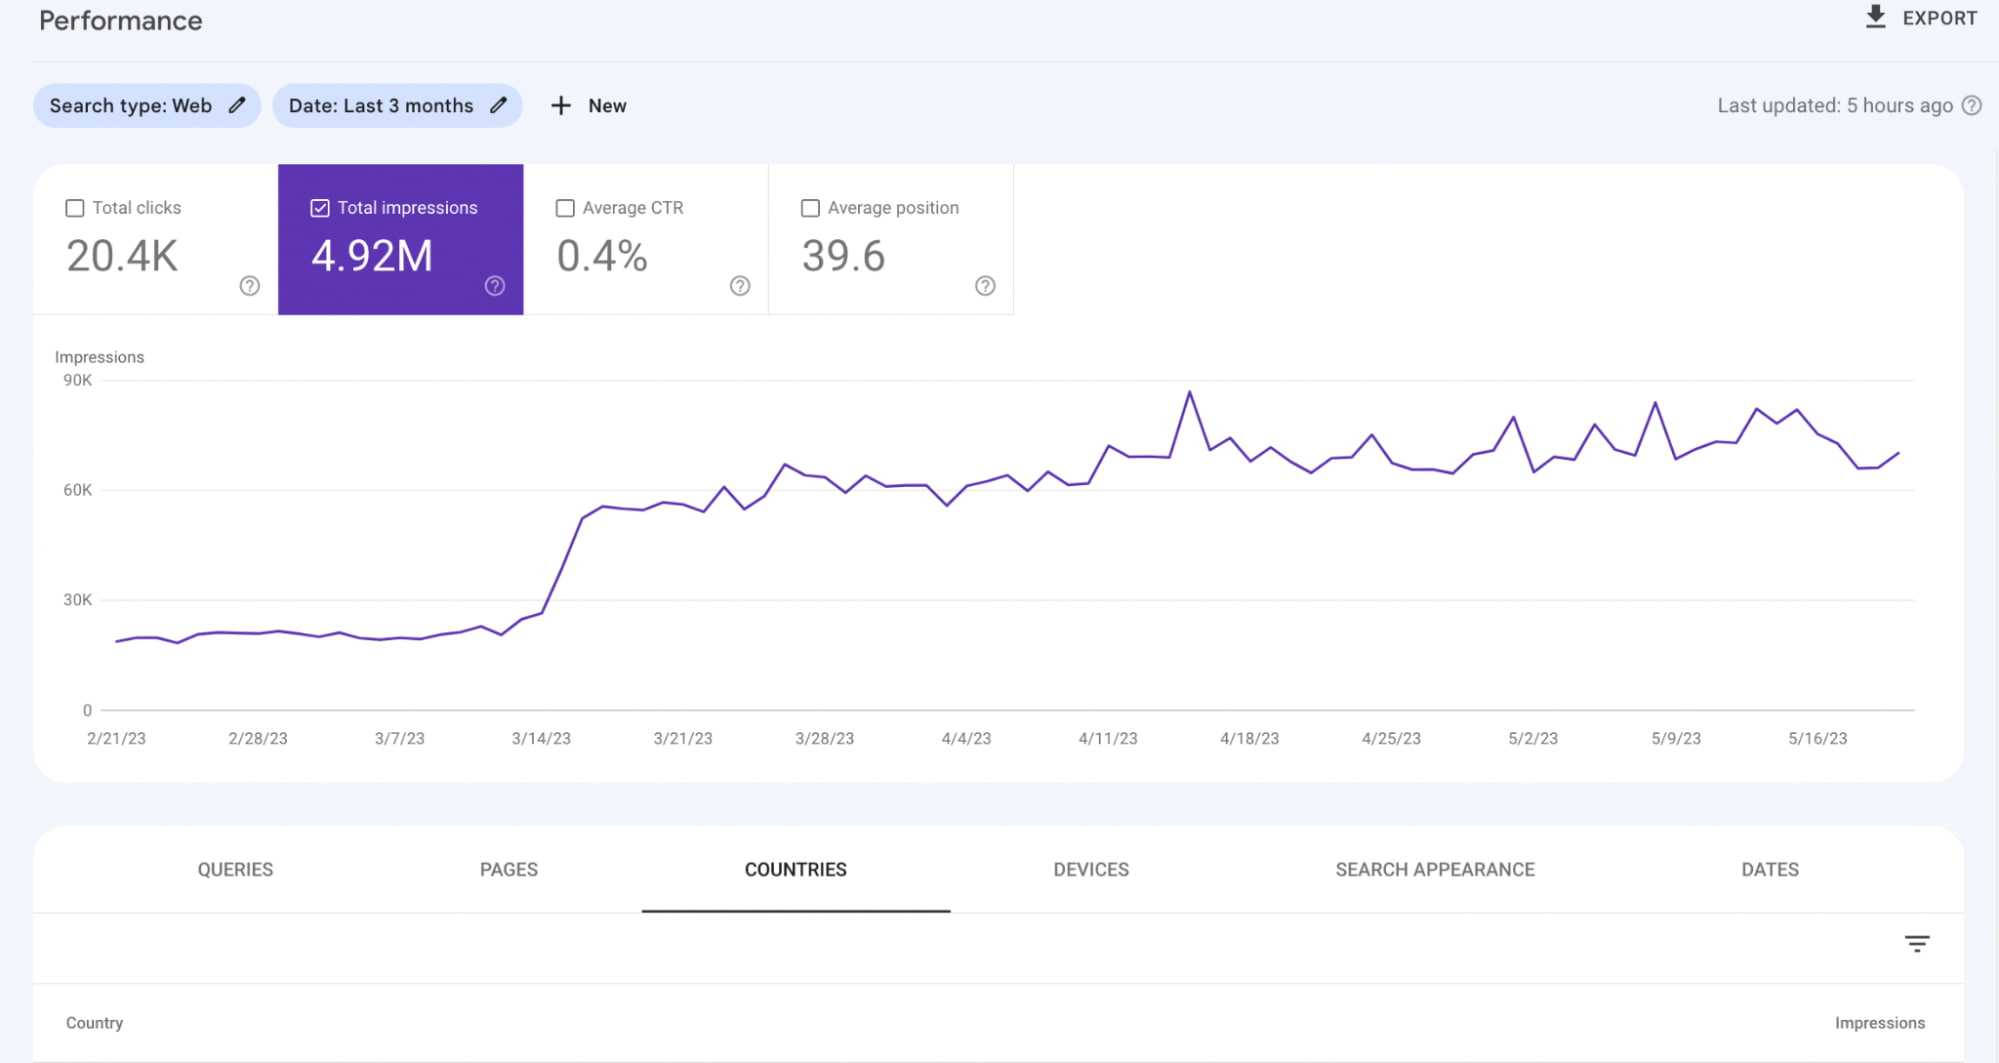
You will need traffic regardless of the type of website you manage. At the same time, depending on what your web platform offers, you may place more importance on certain sorts of traffic than others (traffic by location, country, user age, device, operating system, etc).
• Average Position: If your webpage is ranked higher than the average, users are more likely to view it. With this indicator, you can see the platform’s position in the search results for a given query.
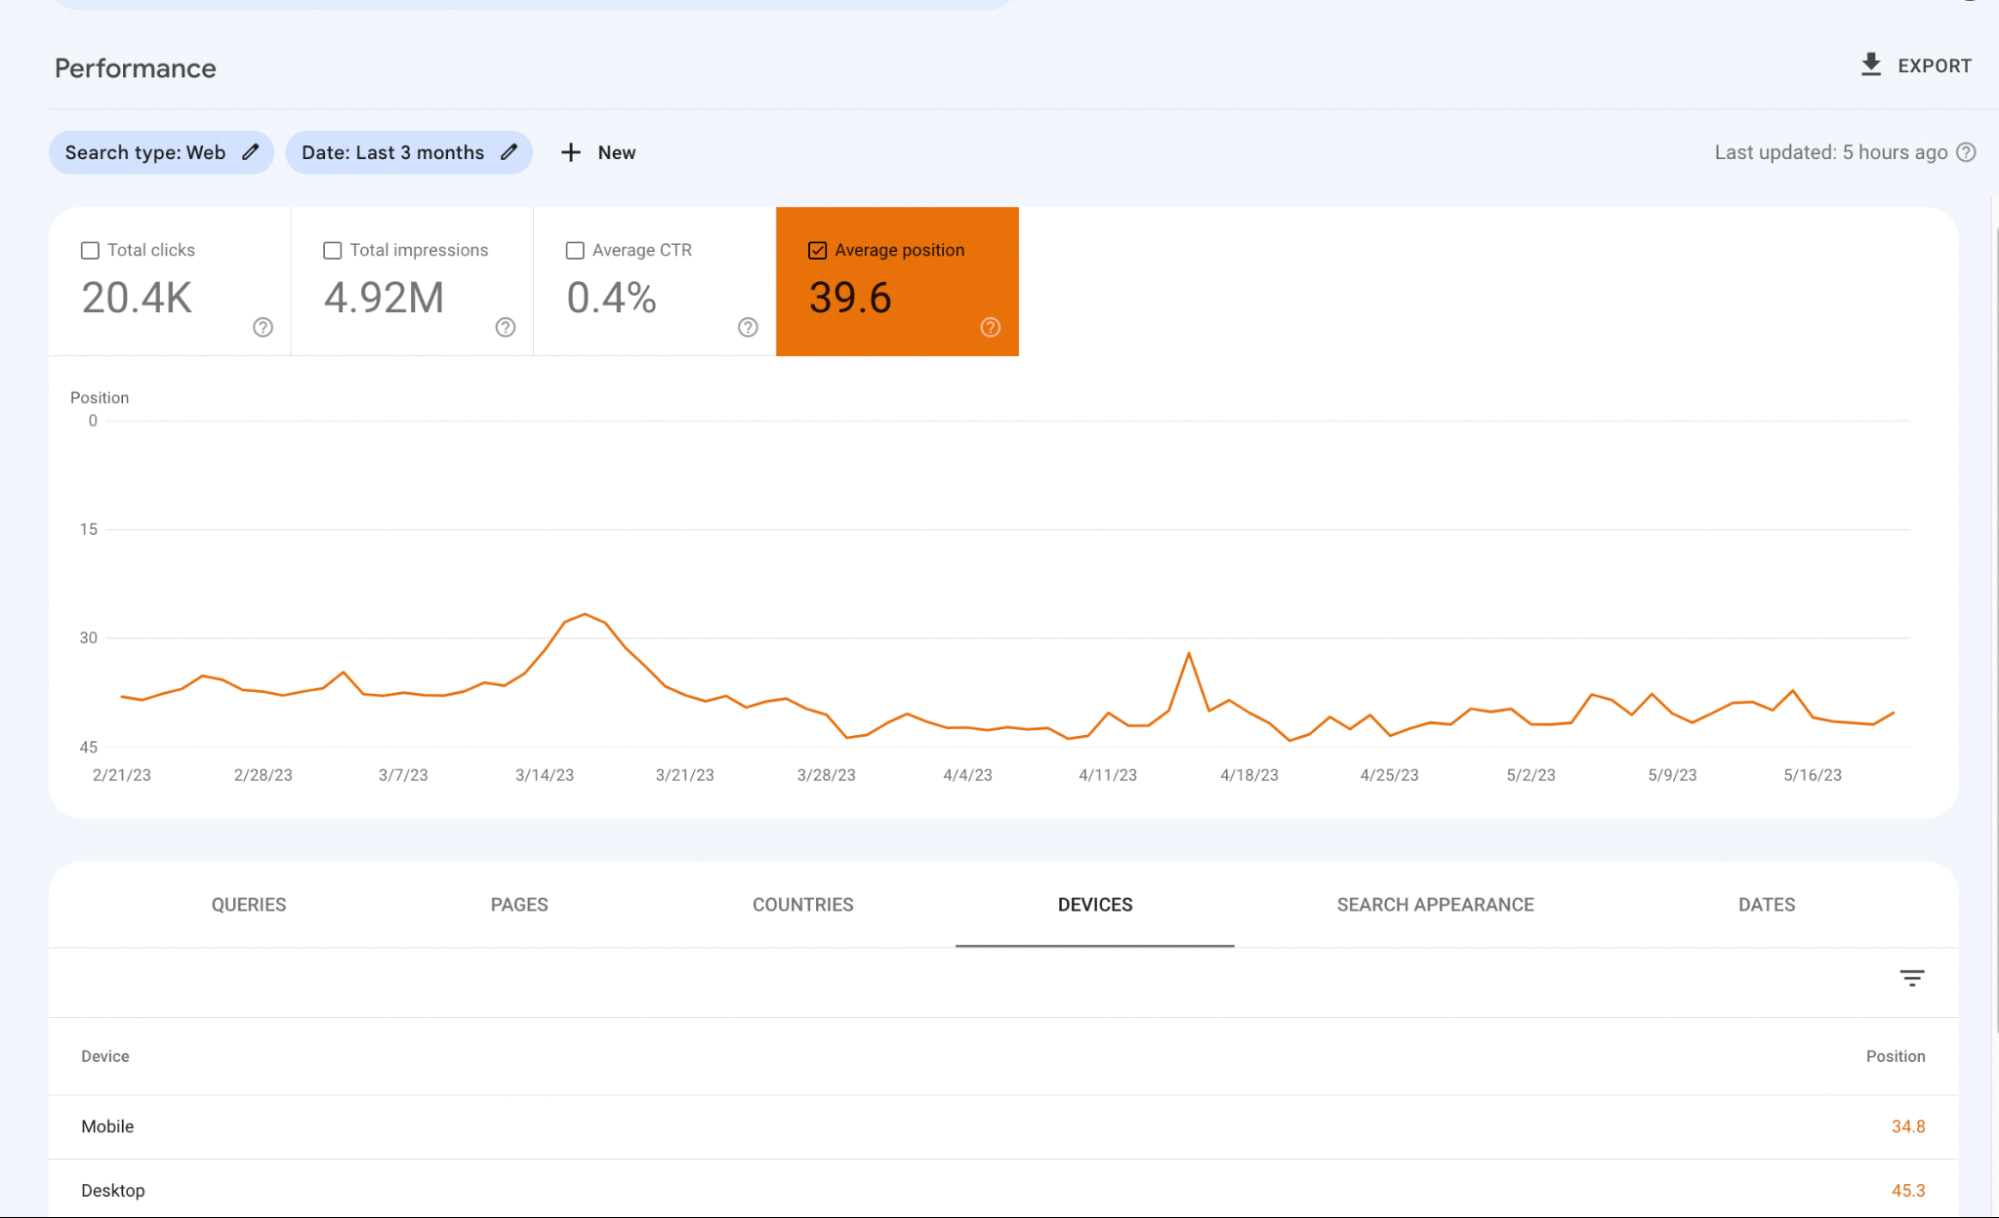
It’s worth noting that a complex algorithm determines this indicator. It considers all pages viewed and produces an average ranking based on that. However, placing too much emphasis on this indicator alone is unnecessary because a dropping average position does not automatically imply poor performance. To clearly understand position dynamics, pay attention to specific inquiries and URLs. Furthermore, search results can vary by geography, with a particular URL ranking differently in various regions. Therefore, obtaining a more accurate picture of website performance and the average position, in general, is possible only by examining the complete set of factors: specific inquiries, regions, devices, and URLs.
• Click-Through Rate (CTR): This metric measures the percentage of visitors to the webpage that clicked on search results after viewing them, compared to all other impressions. A higher CTR signifies a more compelling and relevant search result snippet.
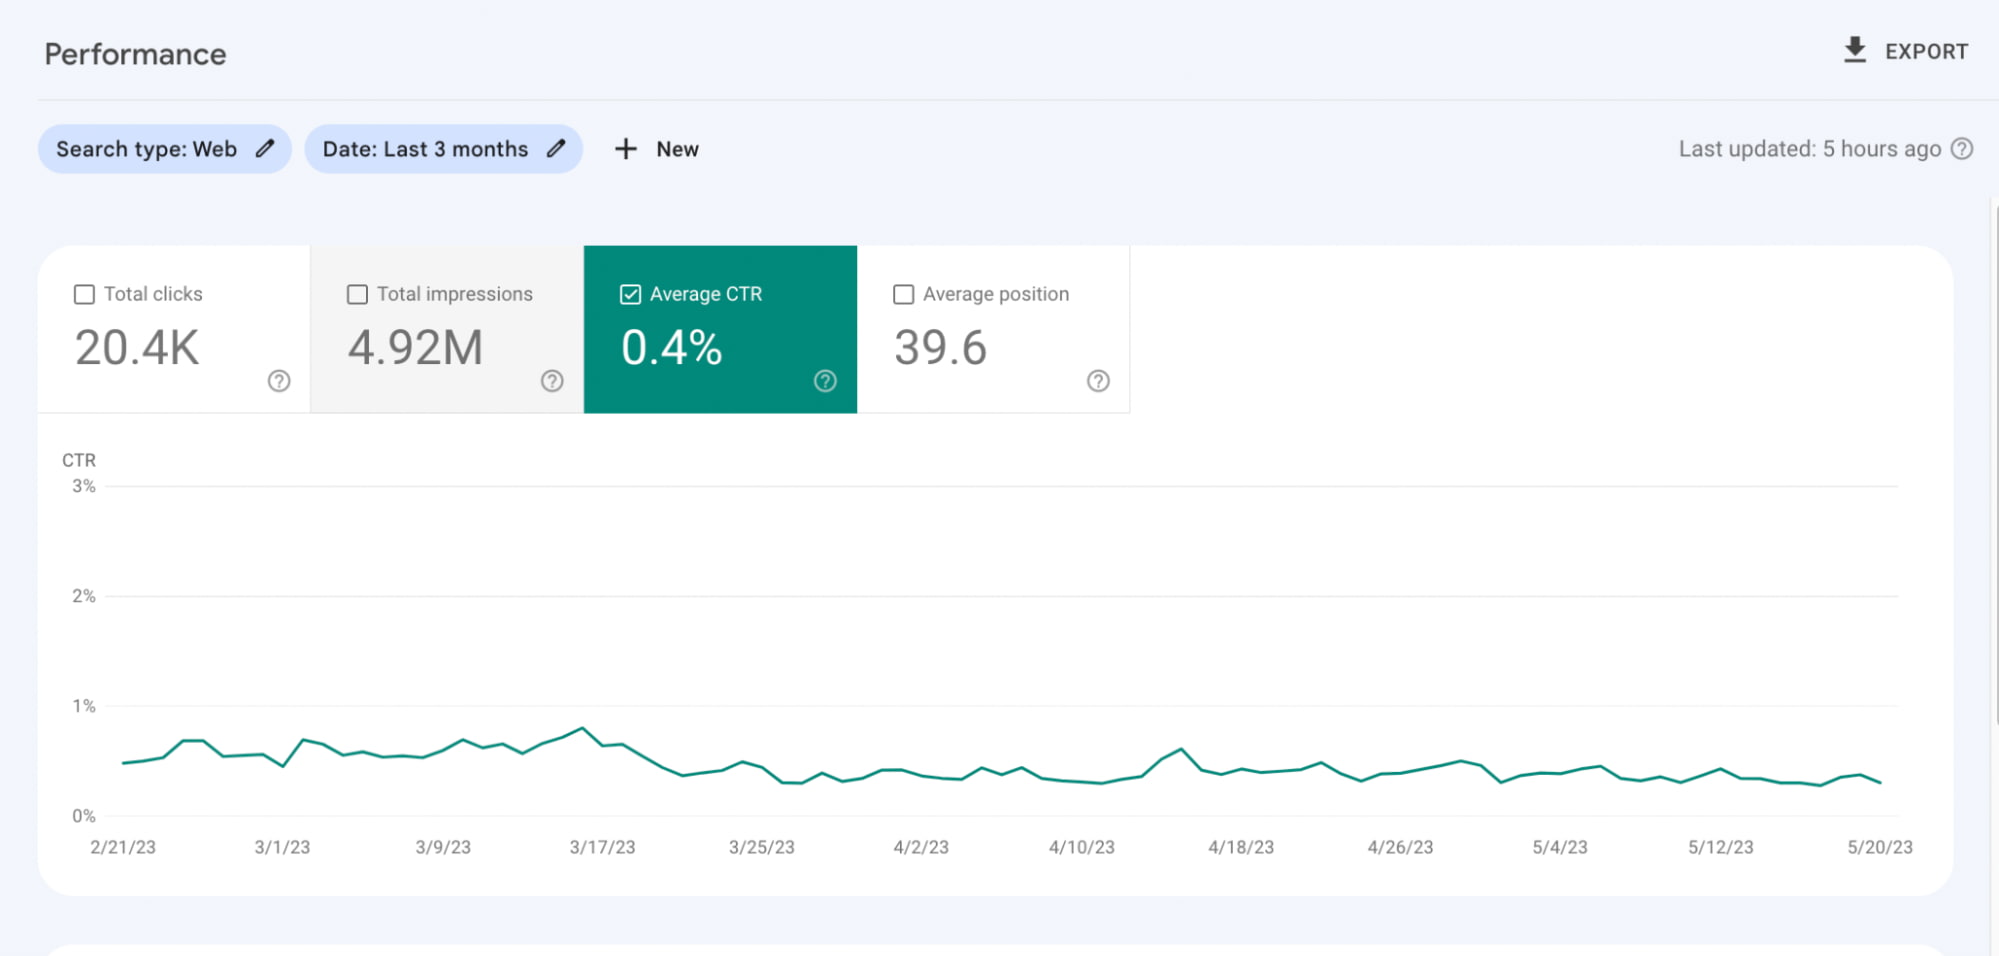
This is an essential indicator of how effectively your search result snippets attract visitors’ attention and convince them to click. A higher CTR shows that your online resource’s meta titles, descriptions, and snippets are relevant and engaging to users’ search queries.
By constantly watching CTR, you can assess how well your search result snippets perform and implement changes to increase click-worthiness. Increasing your CTR and bringing in more visitors to your platform can be accomplished by optimizing your meta tags, using relevant keywords, and generating attractive snippets.
Conclusion
Google Search Console’s Performance Report provides website owners and digital marketers with a success roadmap in the constantly evolving online world. You may gain helpful insights into your website’s functionality by analyzing the provided indicators. Additionally, you can continually improve your SEO strategy and raise the webpage’s visibility, engagement, and performance over time to increase click-worthiness.
Tag – for beginners
Excerpt – This guide will help you explore the performance report and its key indicators in GSC.
Description
This comprehensive guide will provide an in-depth overview of your website’s performance in search results.